Business Intelligence
- Data, Systems, Strategy
Business Intelligence (BI) is the general term used for the technologies, processes and tools used to turn raw data into actionable insights. The field of BI software, and its successful implementation, has grown rapidly in recent years with a huge range of solutions now available to help businesses make more data-driven decisions.
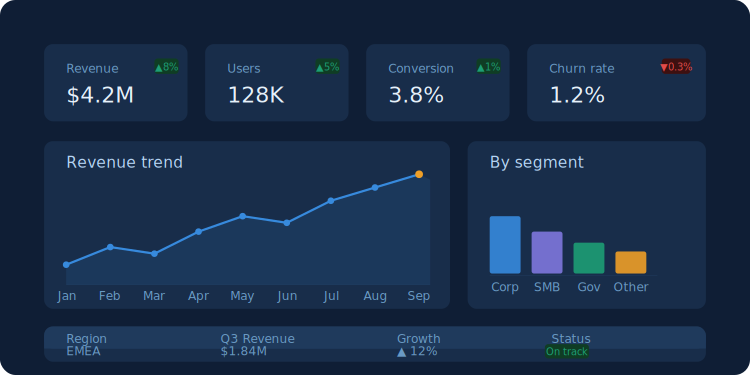
BI solutions can range from reporting and dashboards via Excel to complex Data Warehousing and analytics platforms. The biggest growth area in BI has been in visualisation tools such as PowerBI, Tableau and Qlikview which offer the capability to create interactive dashboards and reports that can be easily shared across an organisation and with external stakeholders. These tools can connect to a wide range of data sources and offer a huge range of visualisation options, allowing trends and important highlights to be communicated in the most effective way for the intended audience. In addition to their flexible features these tools have flexible pricing models, beginning with free versions and progressing through tiers based on the level of usage, allowing them to be implemented in the most efficient and cost effective way.
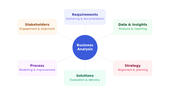
Kontekx are experts not only in the technical solutions available in the field of BI but also in the effective usage of these tools. With the huge range of options offered by these tools it can be easy to create an excess of reports which are misunderstood and not used effectively. We work with key stakeholders to understand the key focus areas and questions to be answered, working to the principle that all insights should be relevant - that we do not report 'noise' - and actionable in predefined ways. Working in this way helps businesses move away from reactive processes towards strategic decision making.
How BI Works
1. Data Sources: Databases, Excel files,
CRM data, downloaded data, website data etc
2. Data Transformation: The obtained data is cleaned and combined into useful structures
3. Data Analysis: Data can now be analysed in myriad ways, from simple analysis to Machine Learning
4. Visualisation: Data and analysis results is loaded into visualisation tools to communicate insights
5. Actions: Following discussion of the insights, plans are implemented to drive business outcomes